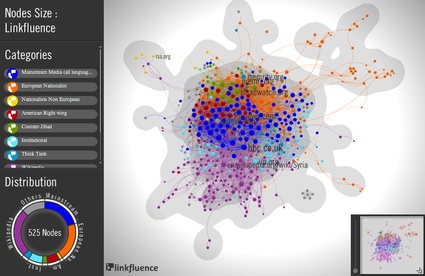
Linkfluence for The Guardian, Anders Breivik's manifesto mapped
I woke up to the news that Linkfluence had been asked by The Guardian to examine and map the webpages Anders Breivik's manifesto are linking to, along with the pages that these in turn link to. I guess it's a way for the Brit daily to celebrate the fact that, unlike Lacoste, it occupies only a negligible place in the gunman's life.
In any case, the story provided me with a smooth and apropos start of a day dedicated entirely to the browsing, reading and right now blogging of one of the latest books that have landed on my desk this Summer.
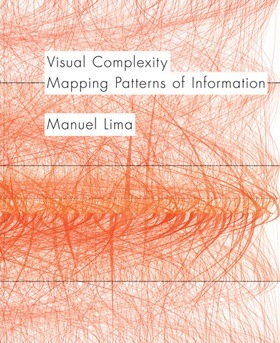 Visual Complexity, Mapping Patterns of Information by Manuel Lima
Publisher Princeton Architectural Press writes:
Our ability to generate information now far exceeds our capacity to understand it. Finding patterns and making meaningful connections inside complex data networks has emerged as one of the biggest challenges of the twenty-first century. In recent years, designers, researchers, and scientists have begun employing an innovative mix of colors, symbols, graphics, algorithms, and interactivity to clarify, and often beautify, the clutter. From representing networks of friends on Facebook to depicting interactions among proteins in a human cell, Visual Complexity presents one hundred of the most interesting examples of information-visualization by the field's leading practitioners. Author Manuel Lima has been called the "Edward Tufte of the 21st century" and nominated as one of the "50 most creative and influential minds of 2009" by Creativity magazine.

Lisa Strausfeld and James Nick Sears, Open Source Spying, 2006
I'm not an information designer. I don't follow as closely as I should what moves and shapes the world of network representation. However, I'm not a complete neophyte and i've received enough books about infoviz to recognize that this one is a gem. The volumes i've been sent over the past few years are either glossy coffee table books containing jaw-dropping images and scarce information or they are heavy accumulations of knowledge and theory that fall out of my indolent hands and brain at the second chapter. Taking the best of both world, the visual punch and the informed text, Visual Complexity, Mapping Patterns of Information has everything it takes to satisfy the curious and the expert alike. It's a precise and pleasant book that does justice to the practice of infoviz and i'm sure that it will be an invaluable reference for the whole design community for years to come.
If Lima knows how to use images to filter and make complex nodes of data more apprehensible, he also seems to be a master in transferring the power of clarity into words.The author writes in a limpid and seemingly effortless way about the 'Ubiquitous Datasphere', 'Segmented Radical Convergence' or 'Multivariate Analysis". No theory entanglements, no information confusion.
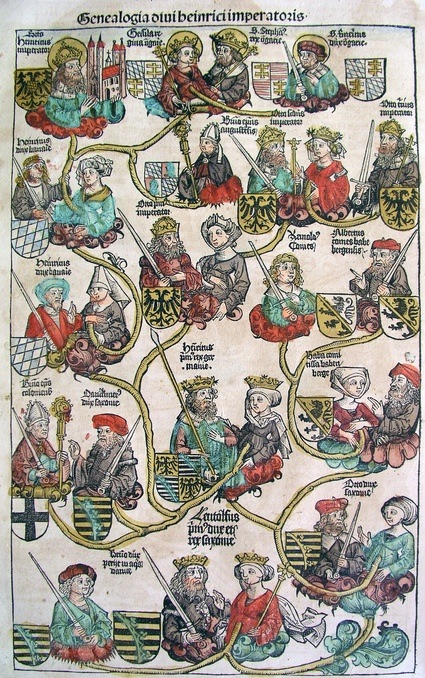
Genealogy of Henry II, Illustrations from the Nuremberg Chronicle, by Hartmann Schedel, 1493
But what's inside the book?
The first chapter, devoted to the trees of life, brings us back to Aristotle and his study of classifications and sub-classifications in Organon. The second chapter moves from trees to network thinking and introduce us to nonlinear ways of envisioning and organizing information. Chapter three, "Decoding Networks' gets deeper into the subject with paragraphs about the pioneers of infoviz and a list of 8 principles that aim to help the work network visualization designers. Next comes a chapter that dissects the most popular subjects of network visualization: exchanges of information on blogs, bibliographic citations, donations to political candidates or environmental organizations, terrorist cells, etc. Chapter 5, 'The Syntax of a New Language' explores the visual techniques designers chose to portray a particular topic. Diagrams, Implosions, Globes, Circles, Spheres, etc. Chapter 6 definitely sold me to the book. with its foray into sculptures and art installations that evoke and translate networks.
Visual Complexity opens on an essay by Lev Manovich and closes with contributions by prominent figures in the world of infoviz: Nathan Yau, Andrew Vande Moere, Christopher Kirwan and David McConville.
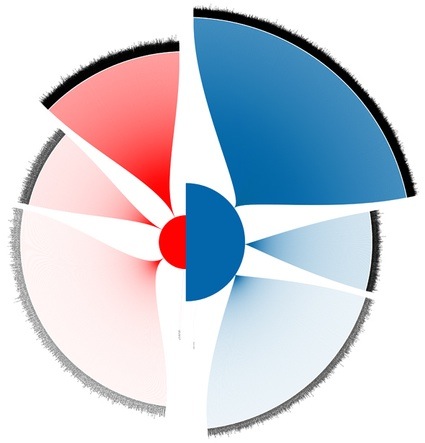
Wesley Grubbs and Nick Yahnke, 2008 Presidential Candidate Donations: McCain vs. Obama, 2007-2008
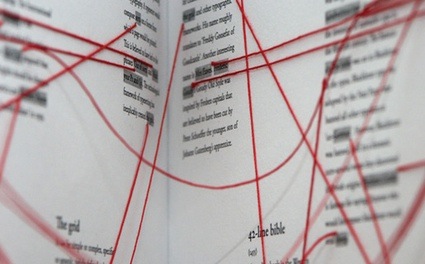
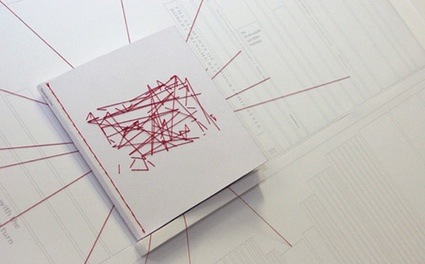
Dan Collier, Typographic Links, 2007
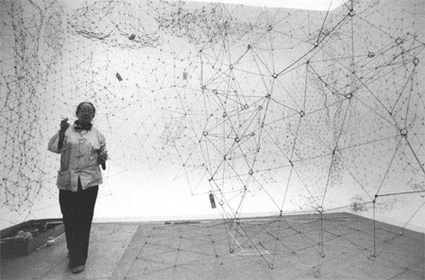
Gertrud Goldschmidt, Reticulárea, 1969
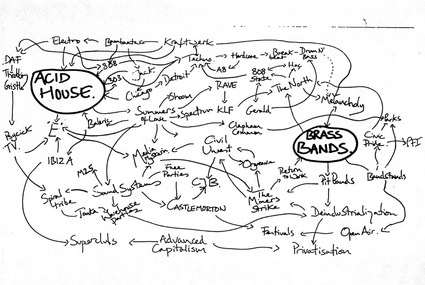
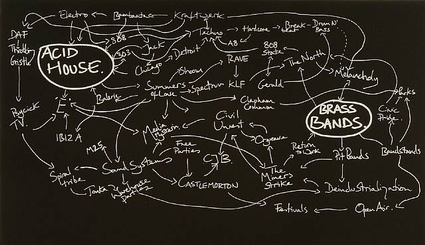
And this is where i'm going to apologize to the wonderfully talented designers whose work is featured in Lima's book. I could have chosen one of their information visualizations to illustrate the post on the homepage, I was actually finding it hard to chose a particular project until i found an entry about Jeremy Deller's History of the World on the blog Visual Complexity. Jeremy. Deller. How could i resist? If Manuel Lima himself believes that my favourite artist is fit to be featured in his blog, how could i not jump on the opportunity to put yet another Deller on my homepage?
No comments:
Post a Comment