 |
| Ben Mazzotta. |
Ben Mazzotta is a postdoc at the Center for Emerging Market Enterprises (CEME).
You’ve got a complex system that you would like to map. Where do you start?
Of course the answer is, “Stop. Put down the pen. Ask yourself what the map must communicate.”
But once you’ve got a clear idea about that, and therefore the data you need to gather, and the way you’d like to analyze that data, … you may well need some new tools.
Network maps
Other approaches
And there’s my writing on dyadic dataset visualization through the use of cross-sections. Rather than a graph theoretic approach, I’ve advocated for the use of cross-sectional maps and hierarchic clustering as alternatives. Cross-sectional maps allow you to present high-quality
cross-sections of trade and investment data. Once you’ve got maps or cartograms of the cross-sections, you can create visualizations of series in the data. Very useful.
Hierarchic clustering can capture other relationships that derive from dyadic data, without directly visualizing the graph itself. I’ve argued that trade relationships derive from concentration of trade, specifically clubs of prominent countries and cliques of polarized trade partners. Hierarchic clusters can distill pictures of these two facets of dyadic trade data, without stacking the deck too much.
[A great conversation with David Braid of The Finance Lab today sparked this little discussion. He is brewing a project the global financial system which looks very promising. Our conversation touched on the Fed's map of the shadow banking system and Jess Bachman's US budget graphic.]
But once you’ve got a clear idea about that, and therefore the data you need to gather, and the way you’d like to analyze that data, … you may well need some new tools.
Network maps
- Mass and spring diagrams, for example in 2d and 3d
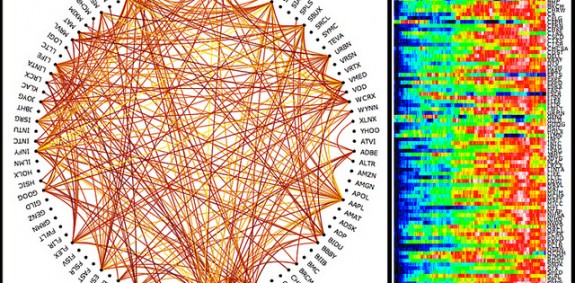
- Circular network diagrams
- Edge frequency distribution, for example in this paper
- Linear layout for visualization of networks
- And the infamous complex systems PDF that made the NYT
- (Beware! Causal loop diagrams have advocates too.)
- William Cleveland Visualizing Data
- Flowing Data
- Information Aesthetics
- Edward Tufte‘s blog
- ggobi
- GraphViz
- Protovis
- statnet (packages within R)
- ucinet (grandfather of social network analysis software)
- INSNA
- Journal of Statistical Software
- CRAN Task View gRaphical models in R
- ReadWriteWeb
- Visual Complexity
- Wikipedia
Other approaches
And there’s my writing on dyadic dataset visualization through the use of cross-sections. Rather than a graph theoretic approach, I’ve advocated for the use of cross-sectional maps and hierarchic clustering as alternatives. Cross-sectional maps allow you to present high-quality
cross-sections of trade and investment data. Once you’ve got maps or cartograms of the cross-sections, you can create visualizations of series in the data. Very useful.
Hierarchic clustering can capture other relationships that derive from dyadic data, without directly visualizing the graph itself. I’ve argued that trade relationships derive from concentration of trade, specifically clubs of prominent countries and cliques of polarized trade partners. Hierarchic clusters can distill pictures of these two facets of dyadic trade data, without stacking the deck too much.
[A great conversation with David Braid of The Finance Lab today sparked this little discussion. He is brewing a project the global financial system which looks very promising. Our conversation touched on the Fed's map of the shadow banking system and Jess Bachman's US budget graphic.]